

PVTIME – On 3rd August 2023, Daqo New Energy Corp. (NYSE: DQ) (“Daqo New Energy,” the “Company” or “we”), a leading manufacturer of high-purity polysilicon for the global solar PV industry, announced its unaudited financial results for the second quarter of 2023.
Second Quarter 2023 Financial and Operating Highlights
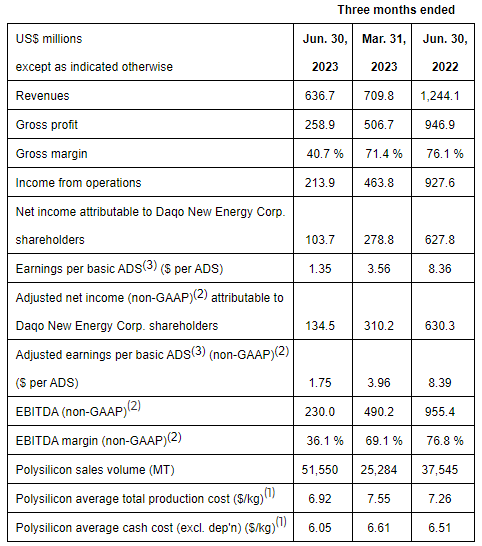
- Polysilicon production volume was 45,306 MT in Q2 2023, compared to 33,848 MT in Q1 2023
- Polysilicon sales volume was 51,550 MT in Q2 2023, compared to 25,284 MT in Q1 2023
- Polysilicon average total production cost(1) was $6.92/kg in Q2 2023, compared to $7.55/kg in Q1 2023
- Polysilicon average cash cost(1) was $6.05/kg in Q2 2023, compared to $6.61/kg in Q1 2023
- Polysilicon average selling price (ASP) was $12.33/kg in Q2 2023, compared to $27.83/kg in Q1 2023
- Revenue was $636.7 million in Q2 2023, compared to $709.8 million in Q1 2023
- Gross profit was $258.9 million in Q2 2023, compared to $506.7 million in Q1 2023. Gross margin was 40.7% in Q2 2023, compared to 71.4% in Q1 2023
- Net income attributable to Daqo New Energy Corp. shareholders was $103.7 million in Q2 2023, compared to $278.8 million in Q1 2023
- Earnings per basic American Depositary Share (ADS)(3) was $1.35 in Q2 2023, compared to $3.56 in Q1 2023
- Adjusted net income (non-GAAP)(2) attributable to Daqo New Energy Corp. shareholders was $134.5 million in Q2 2023, compared to $310.2 million in Q1 2023
- Adjusted earnings per basic ADS(3) (non-GAAP)(2) was $1.75 in Q2 2023, compared to $3.96 in Q1 2023
- EBITDA (non-GAAP)(2) was $230.0 million in Q2 2023, compared to $490.2 million in Q1 2023. EBITDA margin (non-GAAP)(2) was 36.1% in Q2 2023, compared to 69.1% in Q1 2023
Notes:
(1) Production cost and cash cost only refer to production in our polysilicon facilities. Production cost is calculated by the inventoriable costs relating to production of polysilicon divided by the production volume in the period indicated. Cash cost is calculated by the inventoriable costs relating to production of polysilicon excluding depreciation cost and non-cash share-based compensation cost, divided by the production volume in the period indicated.
(2) Daqo New Energy provides EBITDA, EBITDA margins, adjusted net income attributable to Daqo New Energy Corp. shareholders and adjusted earnings per basic ADS on a non-GAAP basis to provide supplemental information regarding its financial performance. For more information on these non-GAAP financial measures, please see the section captioned “Use of Non-GAAP Financial Measures” and the tables captioned “Reconciliation of non-GAAP financial measures to comparable US GAAP measures” set forth at the end of this press release.
(3) ADS means American Depositary Share. One (1) ADS represents five (5) ordinary shares.
Management Remarks
Mr. Longgen Zhang of Daqo New Energy, commented, “Efficient operation of our polysilicon facilities in the second quarter of 2023 resulted in a production volume of 45,306 MT, representing an increase of 11,458 MT as compared to the previous quarter, as our Phase 5A 100,000 MT polysilicon project in Inner Mongolia reached full production capacity in June. Our production cost decreased by 8.3% from Q1 to $6.92/kg, primarily due to improvements in manufacturing efficiency, as well as a reduction in the cost of metallurgical-grade silicon. For the quarter, we generated $230 million in EBITDA with strong operating cash flow and continued to maintain a strong balance sheet with no financial debt. At the end of the quarter, the Company had a cash balance of $3.2 billion and a combined cash and bank note receivable balance of $4.0 billion.”
“With the addition of our new Inner Mongolia Phase 5A facility, our total annual polysilicon nameplate capacity has expanded to 205,000 MT. For the third quarter, we expect total polysilicon production volume to be approximately 55,000 MT to 57,000 MT, representing an increase of 21% to 26% as compared to Q2 2023. Full year production is expected to be approximately 193,000 MT to 198,000 MT of polysilicon, representing an increase of 44% to 48% as compared to 2022. In addition, based on our latest schedule, our new semiconductor-grade polysilicon project with 1,000 MT annual capacity is expected to start pilot production by the end of September 2023. With our fully digitalized and highly automated production system that optimizes operational efficiency, improves cost structure and further enhances product quality for the N-type polysilicon product, we are confident that our Inner Mongolia project will further enhance the Company’s competitive edge.”
“The polysilicon industry experienced increased challenges and substantial price volatility during the second quarter. As several new polysilicon facilities and new entrants finally started production with some reaching full production in the first half of this year, the shortage of polysilicon of the past two years came to an end. The increased supply ultimately led to relative oversupply and excess industry inventory. In an effort to gain market shares with inferior-quality products, new entrants and some established industry players engaged in aggressive pricing. Expectations of lower future pricing in the market led to delays and reductions of downstream customer orders, as well as aggressive pricing requests by customers. The situation worsened significantly in the second half of May, as inventory reduction efforts by leading producers led to a race to the bottom that saw polysilicon prices decline by approximately 70% at the end of the second quarter compared to Q1 levels. In the second half of June, polysilicon prices reached bottom and customers began ordering aggressively at the lower prices. By mid-July, we saw an approximately 15%-20% price recovery compared to the bottom reached in June. Recently, we have also seen an increase in the ASP premium for N-type polysilicon with a meaningful increase in demand volume. We expect that this trend will further benefit us as the industry transitions to next-generation N-type technology.”
“We shipped 53,502MT of polysilicon in Q2, meaningfully more than our production level and a substantial increase over Q1 shipments. Polysilicon inventory at our original Xinjiang facility decreased to less than a week’s production volume. As our facility in Inner Mongolia is newly established, its products require customer qualification before we can ship meaningful volumes to customers, and the qualification process took longer than anticipated due to market volatility during the period. At the end of the quarter, with customer orders on hand that covered all our inventory, we had practically sold all shippable products. The customer qualification process for the products of our Inner Mongolia facility completed successfully in July, and at the end of July, with brisk customer orders and demand, we had further reduced our polysilicon inventory to a very healthy level of approximately one week of production across our two facilities.”
“For the second quarter we recorded approximately $19.7 million in foreign exchange loss, or approximately $0.26 per ADS. Near the end of April, the Company received approximately RMB4.96 billion in cash dividends from its subsidiary Xinjiang Daqo, which was approximately $716.7 million based on the exchange rate on the date the dividend funds were received. During the quarter, the Company converted approximately RMB1.85 billion to US dollars to fund our share repurchase program. As the USD/CNY exchange rate fluctuated significantly during the months of May and June, and as required by accounting standards, we recorded an unrealized foreign exchange loss primarily related to our quarter-end cash balance of RMB3.1 billion held by the Company in an offshore account.”
“Regarding the Company’s share buyback program, at the end of July, the Company had already repurchased 4.16 million ADSs for approximately $188.7 million under the current program, with average cost of approximately $45.32 per ADS. Combined with the program completed in 2022, in aggregate, the Company has already repurchased 6.0 million ADSs for approximately $308.6 million.”
“The continuous cost reduction in solar PV products and the associated reduction in solar energy generation cost are expected to create substantial additional green energy demand, which is likely to exceed most analysts’ expectations. It is generally expected that solar PV will eventually become one of the most important energies to power the world. In addition, as solar PV technology keeps evolving, we believe that the increasing needs for polysilicon of very high purity, such as our N-type polysilicon, will help differentiate us from our competitors. While most of our competitors will likely struggle in the current market environment, Daqo New Energy has one of the best balance sheets in the industry with no financial debt, and this will help us weather the current market environment successfully. We are optimistic that as the solar end market continues to grow, and as our customers continue to expand capacity particularly for N-type solar products, prices will improve. We will continue to maintain solid growth and capture the long-term benefits of the growing global solar PV market.”
Outlook and guidance
The Company expects to produce approximately 55,000MT to 57,000MT of polysilicon during the third quarter of 2023. The Company expects to produce approximately 193,000MT to 198,000MT of polysilicon for the full year of 2023, inclusive of the impact of the Company’s annual facility maintenance.
This outlook reflects Daqo New Energy’s current and preliminary view as of the date of this press release and may be subject to changes. The Company’s ability to achieve these projections is subject to risks and uncertainties. See “Safe Harbor Statement” at the end of this press release.
Second Quarter 2023 Results
Revenues
Revenues were $636.7 million, compared to $709.8 million in the first quarter of 2023 and $1,244.1 million in the second quarter of 2022. The decrease in revenues compared to the first quarter of 2023 was primarily due to a decrease in ASP mitigated by an increase in sales volume.
Gross profit and margin
Gross profit was $258.9 million, compared to $506.7 million in the first quarter of 2023 and $946.9 million in the second quarter of 2022. Gross margin was 40.7%, compared to 71.4% in the first quarter of 2023 and 76.1% in the second quarter of 2022. The decrease in gross margin compared to the first quarter of 2023 was primarily due to lower ASP, which was partially mitigated by lower production cost.
Selling, general and administrative expenses
Selling, general and administrative expenses were $43.3 million, compared to $41.3 million in the first quarter of 2023 and $14.4 million in the second quarter of 2022. SG&A expenses during the second quarter included $27.5 million in non-cash share-based compensation cost related to the Company’s share incentive plans, compared to $28.0 million in the first quarter of 2023.
Research and development expenses
Research and development (R&D) expenses were $2.2 million, compared to $1.9 million in the first quarter of 2023 and $2.7 million in the second quarter of 2022. Research and development expenses can vary from period to period and reflect R&D activities that take place during the quarter.
Foreign exchange loss
Foreign exchange loss was $19.7 million, compared to nil in the first quarter of 2023 and the second quarter of 2022. The significant volatility and fluctuation in the USD/CNY exchange rate during this quarter resulted in an unrealized foreign exchange loss primarily related to our quarter-end cash balance of RMB3.1 billion held by the Company in an offshore account.
Income from operations and operating margin
As a result of the abovementioned, income from operations was $213.9 million, compared to $463.8 million in the first quarter of 2023 and $927.6 million in the second quarter of 2022.
Operating margin was 33.6%, compared to 65.3% in the first quarter of 2023 and 74.6% in the second quarter of 2022.
Net income attributable to Daqo New Energy Corp. shareholders and earnings per ADS
As a result of the abovementioned, net income attributable to Daqo New Energy Corp. shareholders was $103.7 million, compared to $278.8 million in the first quarter of 2023 and $627.8 million in the second quarter of 2022.
Earnings per basic American Depository Share (ADS) was $1.35, compared to $3.56 in the first quarter of 2023, and $8.36 in the second quarter of 2022.
Adjusted income (non-GAAP) attributable to Daqo New Energy Corp. shareholders and adjusted earnings per ADS(non-GAAP)
As a result of the aforementioned, adjusted net income (non-GAAP) attributable to Daqo New Energy Corp. shareholders, excluding non-cash share-based compensation costs, was $134.5 million, compared to $310.2 million in the first quarter of 2023 and $630.3 million in the second quarter of 2022.
Adjusted earnings per basic American Depository Share (ADS) was $1.75 compared to $3.96 in the first quarter of 2023, and $8.39 in the second quarter of 2022.
EBITDA(non-GAAP)
EBITDA (non-GAAP) was $230.0 million, compared to $490.2 million in the first quarter of 2023 and $955.4 million in the second quarter of 2022. EBITDA margin (non-GAAP) was 36.1%, compared to 69.1% in the first quarter of 2023 and 76.8% in the second quarter of 2022.
Financial Condition
As of June 30, 2023, the Company had $3,169.7 million in cash, cash equivalents and restricted cash, compared to $4,130.5 million as of March 31, 2023 and $3,284.3 million as of June 30, 2022. As of June 30, 2023, the notes receivables balance was $798.5 million, compared to $791.3 million as of March 31, 2023 and $1,269.3 million as of June 30, 2022. Notes receivables represent bank notes with maturity within six months.
Cash Flows
For the six months ended June 30, 2023, net cash provided by operating activities was $786.3 million, compared to $1,128.8 million in the same period of 2022.
For the six months ended June 30, 2023, net cash used in investing activities was $495.7 million, compared to net cash used in investing activities of $80.3 million in the same period of 2022. The net cash used in investing activities in the first half of 2023 was primarily related to the capital expenditures on the Company’s polysilicon project in Baotou City, Inner Mongolia.
For the six months ended June 30, 2023, net cash used in financing activities was $477.5 million, compared to net cash provided by financing activities of $1,579.3 million in the same period of 2022. The net cash used in financing activities in the first half of 2023 was primarily related to $173.8 million in stock repurchases and $303.6 million in dividend payment made by the Company’s Xinjiang Daqo subsidiary to its minority shareholders.
Use of Non-GAAP Financial Measures
To supplement Daqo New Energy’s consolidated financial results presented in accordance with United States Generally Accepted Accounting Principles (“US GAAP”), the Company uses certain non-GAAP financial measures that are adjusted for certain items from the most directly comparable GAAP measures including earnings before interest, taxes, depreciation and amortization (“EBITDA”) and EBITDA margin; adjusted net income attributable to Daqo New Energy Corp. shareholders and adjusted earnings per basic and diluted ADS. Our management believes that each of these non-GAAP measures is useful to investors, enabling them to better assess changes in key element of the Company’s results of operations across different reporting periods on a consistent basis, independent of certain items as described below. Thus, our management believes that, used in conjunction with US GAAP financial measures, these non-GAAP financial measures provide investors with meaningful supplemental information to assess the Company’s operating results in a manner that is focused on its ongoing, core operating performance. Our management uses these non-GAAP measures internally to assess the business, its financial performance, current and historical results, as well as for strategic decision-making and forecasting future results. Given our management’s use of these non-GAAP measures, the Company believes these measures are important to investors in understanding the Company’s operating results as seen through the eyes of our management. These non-GAAP measures are not prepared in accordance with US GAAP or intended to be considered in isolation or as a substitute for the financial information prepared and presented in accordance with US GAAP; the non-GAAP measures should be reviewed together with the US GAAP measures, and may be different from non-GAAP measures used by other companies.
The Company uses EBITDA, which represents earnings before interest, taxes, depreciation and amortization, and EBITDA margin, which represents the proportion of EBITDA in revenues. Adjusted net income attributable to Daqo New Energy Corp. shareholders and adjusted earnings per basic and diluted ADS exclude costs related to share-based compensation. Share-based compensation is a non-cash expense that varies from period to period. As a result, our management excludes this item from our internal operating forecasts and models. Our management believes that this adjustment for share-based compensation provides investors with a basis to measure the Company’s core performance, including compared with the performance of other companies, without the period-to-period variability created by share-based compensation.
A reconciliation of non-GAAP financial measures to comparable US GAAP measures is presented later in this document.


 (“Daqo New Energy,” the “Company” or “we”), a leading manufacturer of high-purity polysilicon for the global solar PV…)