Yingli Green Energy Holding Company Limited (NYSE: YGE) (“Yingli Green Energy” or the “Company”), a leading solar energy company and one of the world’s largest vertically integrated photovoltaic manufacturers, which markets its products under the brand “Yingli Solar,” today announced its unaudited consolidated financial results for the quarter and full year ended December 31, 2012.
Fourth Quarter 2012 Consolidated Financial and Operating Summary
- Total net revenues were RMB 2,902.9 million (US$466.0 million).
- PV module shipment increased by 40.6% from the third quarter of 2012.
- Gross loss was RMB 247.8 million (US$39.8 million), representing a gross margin of negative 8.5%. Excluding the impact of a non-cash inventory provision of RMB 121.0 million (US$19.4 million) in this quarter, gross margin of PV modules in the fourth quarter of 2012 would be negative 3.5%.
- Operating loss was RMB 1,130.4 million (US$181.4 million), representing an operating margin of negative 38.9%, which reflects the negative impact of the inventory provision mentioned above, a non-cash impairment of long-lived assets, a non-cash provision for bad debts and a loss of disposal of certain equipment in an aggregate of RMB 484.7 million (US$77.8 million).
- Net loss[1] was RMB 1,249.0 million (US$200.5 million) and loss per ordinary share and per American depositary share (“ADS”) was RMB 7.98 (US$1.28). On an adjusted non-GAAP[2] basis, net loss was RMB 908.3 million (US$145.8 million) and loss per ordinary share and per ADS was RMB 5.80 (US$0.93).
| [1] For convenience purposes, all references to “net loss/income” in this press release, unless otherwise specified, represent “net loss/income attributable to Yingli Green Energy” for all periods presented. |
| [2] All non-GAAP measures exclude, as applicable, share-based compensation, interest expenses consisting of changes in the fair value of the interest rate swap and the amortization of the debt discount, the amortization of intangible assets arising from purchase price allocation in connection with a series of acquisitions of equity interests in Baoding Tianwei Yingli New Energy Resources Co., Ltd. (“Tianwei Yingli”), an operating subsidiary of the Company, inventory provision, impairment of long-lived assets, gain on bargain purchase, valuation allowance for deferred income tax assets, non-cash impairments of goodwill and non-cash provision for inventory purchase commitments. For further details on non-GAAP measures, please refer to the reconciliation table and a detailed discussion of the Company’s use of non-GAAP information set forth elsewhere in this press release. |
Full Year 2012 Consolidated Financial and Operating Summary
- Total net revenues were RMB 11,391.9 million (US$1,828.5 million).
- PV module shipment increased by 43.2% year over year to 2,297.1 MW.
- Gross loss was RMB 368.8 million (US$59.2 million), representing an overall gross margin of negative 3.2%.Excluding the impact of a non-cash inventory provision of RMB 665.4 million (US$106.8 million) in this year, gross margin of PV modules would be 3.0%.
- Operating loss was RMB 2,523.3 million (US$405.0 million), representing an operating margin of negative 22.2%, which was mainly impacted by the inventory provision and the impairment of long-lived assets.
- Net loss was RMB 3,064.4 million (US$491.9 million) and loss per ordinary share and per ADS was RMB 19.59 (US$3.14).
- On an adjusted non-GAAP basis, net loss was RMB 2,097.3 million (US$336.6 million) and loss per ordinary share and per ADS was RMB 13.41 (US$2.15).
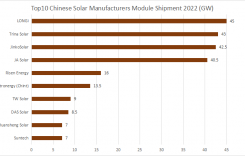
“We’re proud of being ranked by NPD Solarbuzz as the world’s leading PV module supplier in terms of shipment volumes for 2012. With 2.3 GW modules delivered, we have continuously expanded our global market share under the challenging market environment. This historic achievement was built upon our well-recognized brand, superior quality products and services, extensive customer base and our employees’ tireless efforts,” commented Mr. Liansheng Miao, Chairman and Chief Executive Officer of Yingli Green Energy.
“In the fourth quarter, demand in Europe remained stable as a result of continued demand from Germany and contributions from other European markets, while demand in the U.S. experienced a slight seasonal slowdown. Demand in China continued to expand strongly and led our module shipments in the fourth quarter to increase by 40.6% from the third quarter. The steady development of the utility market and the quickly growing distributed generation segment will likely catapult China to become the largest solar market in 2013. We expect to increase our module shipment volumes to China in 2013 by more than 40% compared with 2012.”
“Because of the demand growth in China, U.S., Japan and other new markets, we believe that the global solar market will continue to grow in 2013. In addition to building on our success in Europe, China and the U.S., we will continue to strengthen our marketing and selling efforts in Japan and other regions with high potentials of solar applications, including South America, Southeast Asia and Africa. As a result, we are confident to achieve 3.2 GW to 3.3GW of module shipment in 2013.”
“In addition to further diversifying our sales geographies, we will focus on improving our profitability and optimizing our debt structure to enhance Yingli Green Energy’s ability to withstand future market volatilities. With these strategies and efforts in place, we are confident to further enhance our industry leadership in 2013,” Mr. Miao concluded.
Fourth Quarter 2012 Financial Results
Total Net Revenues
Total net revenues were RMB 2,902.9 million (US$466.0 million) in the fourth quarter of 2012, compared to RMB 2,237.0 million in the third quarter of 2012 and RMB 2,567.6 million in the fourth quarter of 2011. PV module shipments in the fourth quarter of 2012 increased by 40.6% from the third quarter of 2012. The sequential increase in net revenues was primarily attributable to the increased PV modules shipment, which was partially offset by the continuing industry-wide decline in the average selling price of PV modules in this quarter.
Gross Loss (Profit ) and Gross Margin
Gross loss was RMB 247.8 million (US$39.8 million) in the fourth quarter of 2012, compared to gross loss ofRMB 507.8 million in the third quarter of 2012 and gross profit of RMB 77.3 million in the fourth quarter of 2011.
Gross margin was negative 8.5% in the fourth quarter of 2012, compared to gross margin of negative 22.7% in the third quarter of 2012 and gross margin of 3.0% in the fourth quarter of 2011.Gross margin in the fourth quarter of 2012 was negatively impacted by an inventory provision of RMB 121.0 million (US$19.4 million) .
Excluding the impact of the non-cash inventory provision mentioned above, gross margin of PV modules in the fourth quarter of 2012 would be negative 3.5%.
Operating Expenses
Operating expenses were RMB 882.6 million (US$141.7 million) in the fourth quarter of 2012, compared to RMB 423.8 million in the third quarter of 2012 and RMB 3,861.5 million in the fourth quarter of 2011.
In this quarter, the Company recognized a non-cash impairment of long-lived assets of RMB 200.5 million(US$32.2 million) related to the equipment of Fine Silicon, a non-cash provision for bad debts of RMB 101.4 million (US$16.3 million) and a loss of RMB 61.7 million (US$9.9 million) related to disposal of certain equipment. In addition, the increase of operating expenses in the fourth quarter of 2012 was partially attributable to the increase of PV module shipments.
Operating expenses as a percentage of total net revenues was 30.4% in the fourth quarter of 2012. Excluding the impairment of long-lived assets, the provision for bad debts and the loss of disposal of certain equipment mentioned above, operating expenses in the fourth quarter of 2012 would be RMB 518.9 million (US$83.3 million) representing 17.9% of total net revenues. Operating expenses as a percentage of total net revenues was 18.9% in the third quarter of 2012 and 18.0% in the fourth quarter of 2011.
Operating Loss and Margin
Operating loss was RMB 1,130.4 million (US$181.4 million) in the fourth quarter of 2012, compared to RMB 931.5 million in the third quarter of 2012 and RMB 3,784.2 million in the fourth quarter of 2011.
Operating margin was negative 38.9% in the fourth quarter of 2012, compared to negative 41.6% in the third quarter of 2012 and negative 147.4% in the fourth quarter of 2011.
Excluding the inventory provision, the impairment of long-lived assets, the provision for bad debts and the loss of disposal of certain equipment mentioned above, operating loss in the fourth quarter of 2012 would be RMB 645.7 million (US$103.6 million) representing a negative operating margin of 22.2% .
Interest Expense
Interest expense was RMB 209.4 million (US$33.6 million) in the fourth quarter of 2012, compared to RMB 256.0 million in the third quarter of 2012 and RMB 182.0 million in the fourth quarter of 2011. As of December 31, 2012, the Company had an aggregate of RMB 15.5 billion (US$2.5 billion) of bank borrowings and medium-term notes, which slightly decreased from RMB 15.7 billion as of September 30, 2012. The weighted average interest rate was 6.22% in the fourth quarter of 2012, a decrease from 6.33% in the third quarter of 2012. The decrease in interest expense was primarily attributable to the Company’s efforts on optimizing its debt structure, which led to a lower weighted average interest rate.
Foreign Currency Exchange Gain (Loss)
Foreign currency exchange gain was RMB 26.7 million (US$4.3 million) in the fourth quarter of 2012, compared to RMB 52.1 million in the third quarter of 2012 and foreign currency exchange loss of RMB 134.0 million in the fourth quarter of 2011. Given that the Company’s Euro-denominated assets and liabilities are in a net asset position, the foreign currency exchange gain was mainly due to the appreciation of the Euro against the RMB in this quarter.
Income Tax Expense
Income tax expense was RMB 5.0 million (US$0.8 million) in the fourth quarter of 2012, compared to income tax benefit of RMB 97.1 million in the third quarter of 2012 and income tax benefit of RMB 249.3 million in the fourth quarter of 2011. The income tax expense in the fourth quarter of 2012 mainly resulted from a valuation allowance of deferred income tax assets.
Net Loss
Net loss was RMB 1,249.0 million (US$200.5 million) in the fourth quarter of 2012, compared to RMB 959.2 million in the third quarter of 2012 and RMB 3,772.4 million in the fourth quarter of 2011. Loss per ordinary share and per ADS was RMB 7.98 (US$1.28), compared to RMB 6.13 in the third quarter of 2012 and RMB 24.37 in the fourth quarter of 2011.
On an adjusted non-GAAP basis, net loss was RMB 908.3 million (US$145.8 million) in the fourth quarter of 2012, compared to RMB 398.3 million in the third quarter of 2012 and RMB 126.5 million in the fourth quarter of 2011. Adjusted non-GAAP loss per ordinary share and per ADS was RMB 5.80 (US$0.93) in the fourth quarter of 2012, compared to RMB 2.54 in the third quarter of 2012 and RMB 0.82 in the fourth quarter of 2011.
Balance Sheet Analysis
As of December 31, 2012, the Company had RMB 3,051.7 million (US$489.8 million) in cash and restricted cash, compared to RMB 3,720.5 million as of September 30, 2012.
As of December 31, 2012, accounts receivable were RMB 3,918.7 million (US$629.0 million), compared to RMB 3,220.5 million as of September 30, 2012. Days sales outstanding was 121 days in the fourth quarter of 2012, a decrease from 130 days in the third quarter of 2012.
As of December 31, 2012, accounts payable were RMB 3,680.3 million (US$590.7 million), compared to RMB 3,670.2 million as of September 30, 2012. Days payable outstanding was 105 days in the fourth quarter of 2012, compared to 120 days in the third quarter of 2012.
As of the date of this press release, the Company had approximately RMB 3,286.5 million in unutilized short-term lines of credit and RMB 2,394.0 million committed long-term facility that can be drawn down in the near future.
Full Year 2012 Results
Total Net Revenues
Total net revenues in 2012 were RMB 11,391.9 million (US$1,828.5 million), compare to RMB 14,678.0 million in 2011. PV module shipment volume in 2012 was 2,297.1 MW, a significant increase of 43.2% from 1,603.8 MW in 2011. The decrease in total net revenues year-over-year was mainly due to the significant industry-wide decline in the average selling price for PV modules compared to 2011, partially offset by an increase in PV module shipment volume.
Gross Loss (Profit) and Margin
Gross loss in 2012 was RMB 368.8 million (US$59.2 million), compared to gross profit of RMB 2,449.7 million in 2011. Overall gross margin was negative 3.2% in 2012, compared to 16.7% in 2011.
The Company recognized a non-cash inventory provision of RMB 665.4 million (US$106.8 million) in 2012. In 2011, the Company recognized non-cash inventory provision of RMB 469.9 million, upon review of its inventory. Excluding the impact of the non-cash charges mentioned above, gross margin of PV modules would be 3.0% in 2012, compared to 20.6% in 2011.
Operating Expenses
Operating expenses in 2012 were RMB 2,154.5 million (US$345.8 million), compared to RMB 5,144.7 million in 2011. Operating expenses in 2012 were mainly impacted by a non-cash impairment of long-lived assets, a non-cash provision for bad debts and a loss of disposal of certain equipment, while operating expenses in 2011 included a non-cash impairment of long-lived assets relating to Fine Silicon, a non-cash impairment of goodwill, a non-cash provision for bad debts, a loss of disposal of certain equipment and a non-cash provision on the Company’s inventory purchase commitments.
Excluding the above non-cash charges in an aggregate of RMB 383.4 million (US$61.5 million) and RMB 3,488.0 million in 2012 and 2011, respectively, operating expenses in 2012 would be 1,771.1 million (US$284.3 million), compared to RMB 1,656.8 million in 2011. The increase in operating expenses in 2012 was mainly caused by an expanded scale of business.
Operating expenses as a percentage of net revenues was 18.9% in 2012. Excluding the non-cash charges mentioned above, operating expenses as a percentage of net revenues would be 15.5% in 2012, compared to 11.3% in 2011.
Interest Expense
Interest expense in 2012 was RMB 897.1 million (US$144.0 million), compared to RMB 626.7 million in 2011. The increase in interest expense in 2012 was primarily attributable to the Company’s enlarged scale of borrowings, partially offset by its efforts on optimizing the Company’s debt structure As of December 31, 2012, the Company had an aggregate of RMB 15.5 billion (US$2.5 billion) of bank borrowings and medium-term notes, compared to RMB 14.2 billion as of December 31, 2011.The weighted average interest rate for the Company’s borrowings in 2012 was 6.25%, which slightly decreased from 6.33% in 2011.
Foreign Currency Exchange Loss
Foreign currency exchange loss was RMB 78.6 million (US$12.6 million) in 2012, compared to RMB 190.5 million in 2011. Given that the Company’s Euro-denominated assets and liabilities are in a net asset position, the foreign currency exchange loss was mainly due to the depreciation of the Euro against the RMB in both 2012 and 2011.
Income Tax Benefit
Income tax benefit was RMB 205.7 million (US$33.0 million) in 2012, compared to RMB 133.4 million in 2011.
Net Loss
Net loss was RMB 3,064.4 million (US$491.9 million) and loss per ordinary share and per ADS was RMB 19.59(US$3.14) in 2012.
On an adjusted non-GAAP basis, net loss was RMB 2,097.3 million (US$336.6 million) in 2012. Adjusted non-GAAP diluted loss per ordinary share and per ADS was RMB 13.41 (US$2.15) in 2012.
Business Outlook for Full Year 2013
Based on current market and operating conditions, estimated production capacity and forecasted customer demand, the Company expects its PV module shipment target to be in the estimated range of 3.2 GW to 3.3 GW for fiscal year 2013, which represents an increase of 39.4% to 43.7% compared to fiscal year 2012.
Non-GAAP Financial Measures
To supplement the financial measures calculated in accordance with GAAP, this press release includes certain non-GAAP financial measures of adjusted net income (loss) and adjusted diluted earnings (loss) per ordinary share and per ADS, each of which is adjusted to exclude, as applicable, items related to share-based compensation, interest expense consisting of changes in the fair value of the interest-rate swap and the amortization of the debt discount, the amortization of intangible assets arising from purchase price allocation in connection with a series of acquisitions of equity interests in Tianwei Yingli, inventory provision, impairment of long-lived assets, gain on bargain purchase, valuation allowance for deferred income tax assets, non-cash impairments of goodwill and non-cash provision for inventory purchase commitments. The Company believes excluding these items from its non-GAAP financial measures is useful for its management and investors to assess and analyse the Company’s on-going performance as such items are not directly attributable to the underlying performance of the Company’s business operations and do not impact its cash earnings. The Company also believes these non-GAAP financial measures are important to help investors understand the Company’s current financial performance and future prospects and compare business trends among different reporting periods on a consistent basis. These non-GAAP financial measures should be considered in addition to financial measures presented in accordance with GAAP, but should not be considered as a substitute for, or superior to, financial measures presented in accordance with GAAP. For a reconciliation of each of these non-GAAP financial measures to the most directly comparable GAAP financial measure, please see the financial information included elsewhere in this press release.
Currency Conversion
Solely for the convenience of readers, certain Renminbi amounts have been translated into U.S. dollar amounts at the rate of RMB 6.2301 to US$1.00, the noon buying rate in New York for cable transfers of Renminbi per U.S. dollar as set forth in the H.10 weekly statistical release of the Federal Reserve Board as of December 31, 2012. No representation is intended to imply that the Renminbi amounts could have been, or could be, converted, realized or settled into U.S. dollar amounts at such rate, or at any other rate. The percentages stated in this press release are calculated based on Renminbi.
Conference Call
Yingli Green Energy will host a conference call and live webcast to discuss the results at 8:00 AM Eastern Standard Time (EST) on March 4, 2013, which corresponds to 9:00 PM Beijing/Hong Kong time on the same day.
The dial-in details for the live conference call are as follows:
| — U.S. Toll Free Number: | +1-866-519-4004 |
| — International dial-in number: | +1-718-354-1231 |
| — Passcode: | 12754231 |
A live and archived webcast of the conference call will be available on the Investors section of Yingli Green Energy’s website at www.yinglisolar.com. A replay will be available shortly after the call on Yingli Green Energy’s website for 90 days.
A replay of the conference call will be available until March 11, 2013 by dialing:
| — U.S. Toll Free Number: | +1-855-452-5696 |
| — International dial-in number: | +1-646-254-3697 |
| — Passcode: | 12754231 |
About Yingli Green Energy
Yingli Green Energy Holding Company Limited (NYSE: YGE), which markets its products under the brand “Yingli Solar,” is a leading solar energy company and one of the world’s largest vertically integrated photovoltaic manufacturers. Yingli Green Energy’s manufacturing covers the entire photovoltaic value chain, from the production of polysilicon through ingot casting and wafering, to solar cell production and module assembly. Yingli Green Energy currently maintains a balanced vertically integrated production capacity of 2,450 MW per year at its production facilities located in Baoding, Haikou, Tianjin and Hengshui, respectively. Yingli Green Energy distributes its photovoltaic modules to a wide range of markets, including Germany, Spain, Italy, Greece, France,South Korea, China and the United States. Headquartered in Baoding, China, Yingli Green Energy has more than 20 subsidiaries and branch offices worldwide. Yingli Green Energy is publicly listed on the New York Stock Exchange (NYSE: YGE). For more information, please visit www.yinglisolar.com.
Safe Harbor Statement
This press release contains forward-looking statements. These statements constitute “forward-looking” statements within the meaning of Section 21E of the Securities Exchange Act of 1934, as amended, and as defined in the U.S. Private Securities Litigation Reform Act of 1995. These forward-looking statements can be identified by terminology such as “will,” “expects,” “anticipates,” “future,” “intends,” “plans,” “believes,” “estimates,” “target” and similar statements. Such statements are based upon management’s current expectations and current market and operating conditions, and relate to events that involve known or unknown risks, uncertainties and other factors, all of which are difficult to predict and many of which are beyond Yingli Green Energy’s control, which may cause Yingli Green Energy’s actual results, performance or achievements to differ materially from those in the forward-looking statements. Further information regarding these and other risks, uncertainties or factors is included in Yingli Green Energy’s filings with the U.S. Securities and Exchange Commission. Yingli Green Energy does not undertake any obligation to update any forward-looking statement as a result of new information, future events or otherwise, except as required under applicable law.
For further information, please contact:
| Qing Miao |
| Vice President of Corporate Communications |
| Yingli Green Energy Holding Company Limited |
| Tel: +86 312 8929787 |
| Email: ir@yinglisolar.com |
| YINGLI GREEN ENERGY HOLDING COMPANY LIMITED AND SUBSIDIARIES | ||||||
| Unaudited Condensed Consolidated Balance Sheets | ||||||
| (In thousands) | ||||||
| December 31, 2011 | December 31, 2012 | |||||
| RMB | RMB | US$ | ||||
| ASSETS | ||||||
| Current assets: | ||||||
| Cash and restricted cash | 5,613,320 | 3,051,743 | 489,839 | |||
| Accounts receivable, net | 2,411,886 | 3,918,666 | 628,989 | |||
| Inventories | 2,670,919 | 2,523,550 | 405,058 | |||
| Prepayments to suppliers | 386,939 | 239,912 | 38,509 | |||
| Prepaid expenses and other current assets | 1,655,231 | 1,379,003 | 221,345 | |||
| Total current assets | 12,738,295 | 11,112,874 | 1,783,740 | |||
| Long-term prepayments to suppliers | 1,322,714 | 1,280,131 | 205,475 | |||
| Property, plant and equipment, net | 12,389,184 | 13,218,200 | 2,121,667 | |||
| Land use rights | 523,219 | 710,183 | 113,992 | |||
| Intangible assets, net | 110,386 | 62,812 | 10,082 | |||
| Other assets | 399,615 | 769,386 | 123,495 | |||
| Total assets | 27,483,413 | 27,153,586 | 4,358,451 | |||
| LIABILITIES AND SHAREHOLDERS’ EQUITY | ||||||
| Current liabilities: | ||||||
| Short-term bank borrowings, including current portion of long-term debt | 8,225,076 | 7,526,015 | 1,208,009 | |||
| Convertible notes | 139,345 | – | – | |||
| Accounts payable | 2,977,230 | 3,680,259 | 590,722 | |||
| Other current liabilities and accrued expenses | 1,607,961 | 1,734,695 | 278,439 | |||
| Total current liabilities | 12,949,612 | 12,940,969 | 2,077,170 | |||
| Long-term debt, excluding current portion | 3,451,899 | 4,076,456 | 654,316 | |||
| Medium-term notes | 2,406,391 | 3,911,907 | 627,904 | |||
| Accrued warranty cost, excluding current portion | 425,350 | 519,539 | 83,392 | |||
| Other liabilities | 1,196,500 | 1,487,944 | 238,831 | |||
| Total liabilities | 20,429,752 | 22,936,815 | 3,681,613 | |||
| Shareholders’ equity: | ||||||
| Ordinary shares | 12,011 | 12,241 | 1,965 | |||
| Additional paid-in capital | 6,476,123 | 6,634,852 | 1,064,967 | |||
| Treasury stock | (123,838) | (127,332) | (20,438) | |||
| Accumulated other comprehensive income | 138,999 | 237,385 | 38,103 | |||
| Accumulated deficit | (1,342,098) | (4,406,510) | (707,294) | |||
| Total equity attributable to Yingli Green Energy | 5,161,197 | 2,350,636 | 377,303 | |||
| Noncontrolling interests | 1,892,464 | 1,866,135 | 299,535 | |||
| Total shareholders’ equity | 7,053,661 | 4,216,771 | 676,838 | |||
| Total liabilities and shareholders’ equity | 27,483,413 | 27,153,586 | 4,358,451 | |||
| YINGLI GREEN ENERGY HOLDING COMPANY LIMITED AND SUBSIDIARIES | |||||||||||
| Unaudited Condensed Statements of Comprehensive Income | |||||||||||
| (In thousands, except for share, ADS, per share and per ADS data) | |||||||||||
| Three months ended | |||||||||||
| December 31, 2011 | September 30, 2012 | December 31, 2012 | |||||||||
| RMB | RMB | RMB | US$ | ||||||||
| Net revenues: | |||||||||||
| Sales of PV modules | 2,503,157 | 2,164,493 | 2,684,571 | 430,903 | |||||||
| Sales of PV systems | 35,948 | 28,814 | 119,147 | 19,124 | |||||||
| Other revenues | 28,490 | 43,684 | 99,213 | 15,925 | |||||||
| Total net revenues | 2,567,595 | 2,236,991 | 2,902,931 | 465,952 | |||||||
| Cost of revenues: | |||||||||||
| Cost of PV modules sales | (2,396,760) | (2,670,396) | (2,900,192) | (465,513) | |||||||
| Cost of PV systems sales | (30,176) | (21,009) | (119,413) | (19,167) | |||||||
| Cost of other revenues | (63,335) | (53,343) | (131,145) | (21,050) | |||||||
| Total cost of revenues | (2,490,271) | (2,744,748) | (3,150,750) | (505,730) | |||||||
| Gross profit (loss) | 77,324 | (507,757) | (247,819) | (39,778) | |||||||
| Selling expenses | (221,542) | (206,647) | (242,210) | (38,877) | |||||||
| General and administrative expenses | (193,198) | (163,027) | (386,869) | (62,097) | |||||||
| Research and development expenses | (46,672) | (54,096) | (52,977) | (8,503) | |||||||
| Provision for inventory purchase commitments | (851,694) | – | |||||||||
| Impairment of long-lived assets and goodwill | (2,548,406) | – | (200,497) | (32,182) | |||||||
| Total operating expenses | (3,861,512) | (423,770) | (882,553) | (141,659) | |||||||
| Loss from operations | (3,784,188) | (931,527) | (1,130,372) | (181,437) | |||||||
| Other income (expense): | |||||||||||
| Interest expense | (181,993) | (256,008) | (209,368) | (33,606) | |||||||
| Interest income | 11,254 | 3,445 | 11,220 | 1,801 | |||||||
| Foreign currency exchange gains (losses) | (133,969) | 52,128 | 26,659 | 4,279 | |||||||
| Other income | 18,787 | 17,453 | 21,160 | 3,397 | |||||||
| Loss before income taxes | (4,070,109) | (1,114,509) | (1,280,701) | (205,566) | |||||||
| Income tax benefit (expense) | 249,321 | 97,053 | (5,015) | (805) | |||||||
| Net loss | (3,820,788) | (1,017,456) | (1,285,716) | (206,371) | |||||||
| Less: Loss attributable to the noncontrolling interests | 48,435 | 58,232 | 36,692 | 5,889 | |||||||
| Net loss attributable to Yingli Green Energy | (3,772,353) | (959,224) | (1,249,024) | (200,482) | |||||||
| Weighted average shares and ADSs outstanding | |||||||||||
| Basic and diluted | 154,769,797 | 156,580,455 | 156,585,020 | 156,585,020 | |||||||
| Loss per share and per ADS | |||||||||||
| Basic and diluted | (24.37) | (6.13) | (7.98) | (1.28) | |||||||
| Net loss | (3,820,788) | (1,017,456) | (1,285,716) | (206,371) | |||||||
| Other comprehensive income (loss) | |||||||||||
| Foreign currency exchange translation adjustment, net of nil tax | 13,177 | 32,702 | 5,020 | 806 | |||||||
| Cash flow hedging derivatives, net of nil tax | (4,092) | (969) | 1,134 | 182 | |||||||
| Comprehensive loss | (3,811,703) | (985,723) | (1,279,562) | (205,383) | |||||||
| Less: Comprehensive loss attributable to the noncontrolling interest | 50,392 | 51,725 | 29,366 | 4,714 | |||||||
| Comprehensive loss attributable to Yingli Green Energy | (3,761,311) | (933,998) | (1,250,196) | (200,669) | |||||||
|
Reconciliation of Non-GAAP measures to GAAP measures |
|||||||||||||||||||||
| Three months ended | |||||||||||||||||||||
| December 31, 2011 | September 30, 2012 | December 31, 2012 | |||||||||||||||||||
| RMB | RMB | RMB | US$ | ||||||||||||||||||
| Non-GAAP loss attributable to Yingli Green Energy | (126,502) | (398,337) | (908,259) | (145,785) | |||||||||||||||||
| Share-based compensation | (22,297) | (6,858) | (8,499) | (1,364) | |||||||||||||||||
| Amortization of intangible assets | (11,967) | (11,967) | (10,821) | (1,737) | |||||||||||||||||
| Inventory provision | (211,245) | (523,203) | (121,005) | (19,423) | |||||||||||||||||
| Impairment of long-lived assets | (2,275,024) | – | (200,497) | (32,182) | |||||||||||||||||
| Impairment of goodwill | (273,382) | – | – | – | |||||||||||||||||
| Provision for inventory purchase commitments | (851,694) | – | – | – | |||||||||||||||||
| Interest expenses consisting of changes in fair value of the interest rate swap and the amortization of the debt discount | (242) | (671) | 57 | 9 | |||||||||||||||||
| Non-cash valuation allowance for deferred income tax assets | – | (18,188) | – | – | |||||||||||||||||
| Net loss attributable to Yingli Green Energy | (3,772,353) | (959,224) | (1,249,024) | (200,482) | |||||||||||||||||
| Non-GAAP diluted loss per share and per ADS | (0.82) | (2.54) | (5.80) | (0.93) | |||||||||||||||||
| Diluted loss per share and per ADS | (24.37) | (6.13) | (7.98) | (1.28) | |||||||||||||||||
| YINGLI GREEN ENERGY HOLDING COMPANY LIMITED AND SUBSIDIARIES | ||||||||||||||||
| Unaudited Condensed Consolidated Statements of Operations | ||||||||||||||||
| (In thousands, except for share, ADS, per share and per ADS data) | ||||||||||||||||
| Year ended | ||||||||||||||||
| December 31, 2011 | December 31, 2012 | |||||||||||||||
| RMB | RMB | US$ | ||||||||||||||
| Net revenues: | ||||||||||||||||
| Sales of PV modules | 14,397,086 | 10,989,767 | 1,763,979 | |||||||||||||
| Sales of PV systems | 53,731 | 171,013 | 27,449 | |||||||||||||
| Other revenues | 227,148 | 231,148 | 37,102 | |||||||||||||
| Total net revenues | 14,677,965 | 11,391,928 | 1,828,530 | |||||||||||||
| Cost of revenues: | ||||||||||||||||
| Cost of PV modules sales | (11,905,502) | (11,329,951) | (1,818,582) | |||||||||||||
| Cost of PV systems sales | (43,280) | (155,310) | (24,929) | |||||||||||||
| Cost of other revenues | (279,504) | (275,468) | (44,216) | |||||||||||||
| Total cost of revenues | (12,228,286) | (11,760,729) | (1,887,727) | |||||||||||||
| Gross profit (loss) | 2,449,679 | (368,801) | (59,197) | |||||||||||||
| Selling expenses | (818,022) | (893,331) | (143,390) | |||||||||||||
| General and administrative expenses | (641,716) | (873,148) | (140,150) | |||||||||||||
| Research and development expenses | (284,909) | (187,538) | (30,102) | |||||||||||||
| Provision for inventory purchase commitments | (851,694) | |||||||||||||||
| Impairment of long-lived assets and goodwill | (2,548,406) | (200,497) | (32,182) | |||||||||||||
| Total operating expenses | (5,144,747) | (2,154,514) | (345,823) | |||||||||||||
| Loss from operations | (2,695,068) | (2,523,315) | (405,020) | |||||||||||||
| Other income (expense): | ||||||||||||||||
| Interest expense | (626,737) | (897,124) | (143,998) | |||||||||||||
| Interest income | 28,852 | 46,446 | 7,455 | |||||||||||||
| Foreign currency exchange losses | (190,475) | (78,599) | (12,616) | |||||||||||||
| Gain on bargain purchase from an acquisition | 52,202 | – | – | |||||||||||||
| Other income | 32,036 | 54,963 | 8,822 | |||||||||||||
| Loss before income taxes | (3,399,190) | (3,397,629) | (545,357) | |||||||||||||
| Income tax benefit | 133,413 | 205,742 | 33,024 | |||||||||||||
| Net loss | (3,265,777) | (3,191,887) | (512,333) | |||||||||||||
| Less: Loss attributable to the non-controlling interests | 56,866 | 127,475 | 20,461 | |||||||||||||
| Net loss attributable to Yingli Green Energy | (3,208,911) | (3,064,412) | (491,872) | |||||||||||||
| Weighted average shares and ADSs outstanding | ||||||||||||||||
| Basic and diluted | 156,805,040 | 156,425,307 | 156,425,307 | |||||||||||||
| Loss per share and per ADS | ||||||||||||||||
| Basic and diluted | (20.46) | (19.59) | (3.14) | |||||||||||||
| Net loss | (3,265,777) | (3,191,887) | (512,333) | |||||||||||||
| Other comprehensive income (loss) | ||||||||||||||||
| Foreign currency exchange translation adjustment, net of nil tax | 71,275 | 116,993 | 18,779 | |||||||||||||
| Cash flow hedging derivatives, net of nil tax | (343) | (424) | (68) | |||||||||||||
| Comprehensive loss | (3,194,845) | (3,075,318) | (493,622) | |||||||||||||
| Less: Comprehensive loss attributable to the noncontrolling interest | 65,773 | 100,923 | 16,199 | |||||||||||||
| Comprehensive loss attributable to Yingli Green Energy | (3,129,072) | (2,974,395) | (477,423) | |||||||||||||
| Reconciliation of Non-GAAP measures to GAAP measures | ||||||
| Year ended | ||||||
| December 31, 2011 | December 31, 2012 | |||||
| RMB | RMB | US$ | ||||
| Non-GAAP income (loss) attributable to Yingli Green Energy | 773,747 | (2,097,264) | (336,635) | |||
| Share-based compensation | (64,674) | (34,368) | (5,516) | |||
| Amortization of intangible assets | (47,867) | (46,721) | (7,499) | |||
| Impairment of long-lived assets | (2,275,024) | (200,497) | (32,182) | |||
| Impairment of goodwill | (273,382) | – | – | |||
| Provision for inventory purchase commitments | (851,694) | – | – | |||
| Inventory provision | (469,873) | (665,416) | (106,807) | |||
| Gain on bargain purchase | 52,202 | – | – | |||
| Valuation allowance for deferred tax assets | (28,862) | (18,188) | (2,919) | |||
| Non-cash interest expenses consisting of changes in fair value of the interest rate swap and the amortization of the debt discount | (23,484) | (1,958) | (314) | |||
| Net loss attributable to Yingli Green Energy | (3,208,911) | (3,064,412) | (491,872) | |||
| Non-GAAP diluted earnings (loss) per share and per ADS | 4.81 | (13.41) | (2.15) | |||
| Diluted loss per share and per ADS | (20.46) | (19.59) | (3.14) | |||


